xhprof的实现探讨
最近感兴趣看了下xhprof的内部实现,本文将针对xhprof的各个功能点进行分析。
关键数据结构
xhprof主要只使用了如下两个数据结构:

xhprof的两种分析模式
1、XHPROF_MODE_HIERARCHICAL模式,该模式是详细分析整个PHP代码的执行情况,其输出的分析数据如下:
1
2
3
4
5
6
7
8
9
10
11
12
13
14
15
16
17
18
19
20
21
22
23
24
25
26
27
28
29
30
31
32
33
34
35
36
37
38
39
40
<?php
array(7) {
  ["main()==>load::./inc.php"]=>
  array(5) {
    ……
  }
  ["main()==>run_init::Test/inc.php"]=>
  array(5) {
    ……
  }
  ["bar==>echoHello"]=>
  array(5) {
    ……
  }
  ["foo==>bar"]=>
  array(5) {
    ……
  }
  ["main()==>foo"]=>
  array(5) {
    ……
  }
  ["main()==>xhprof_disable"]=>
  array(5) {
    ……
  }
  ["main()"]=>
  array(5) {
    ["ct"]=>
    int(1)
    ["wt"]=>
    int(390372)
    ["cpu"]=>
    int(392000)
    ["mu"]=>
    int(15040)
    ["pmu"]=>
    int(10024)
  }
}
2、XHPROF_MODE_SAMPLED模式,该模式每隔0.1秒取样一次,记录当前执行的堆栈,其输出的分析数据如下:
1
2
3
4
5
6
7
8
9
10
11
12
13
<?php
array(5) {
  ["1460294938.300000"]=>
  string(30) "main()==>foo==>bar==>echoHello"
  ["1460294938.400000"]=>
  string(30) "main()==>foo==>bar==>echoHello"
  ["1460294938.500000"]=>
  string(30) "main()==>foo==>bar==>echoHello"
  ["1460294938.600000"]=>
  string(30) "main()==>foo==>bar==>echoHello"
  ["1460294938.700000"]=>
  string(30) "main()==>foo==>bar==>echoHello"
}
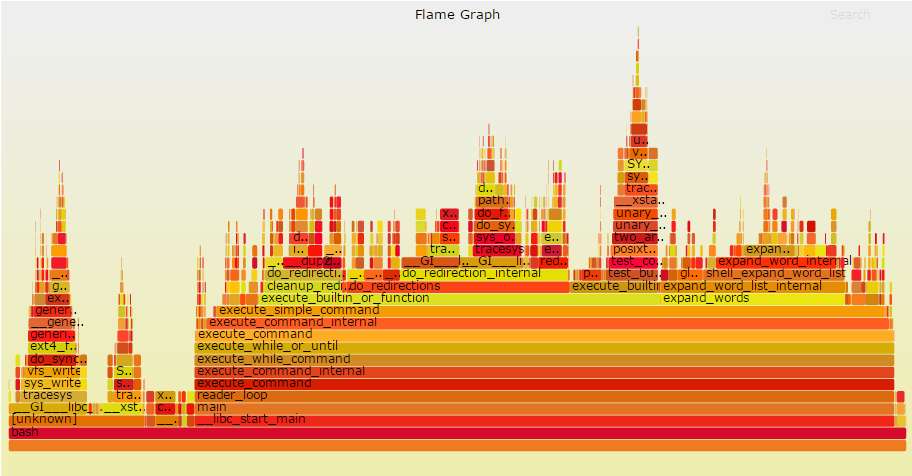
该模式通过使用xhprof-flamegraphs和FlameGraph可生成flame graph,如下图(我的测试代码的图太简陋,就用xhprof-flamegraphs的图代之了= =):
XHPROF_MODE_HIERARCHICAL模式分析
一、xhprof_enable([ int $flags = 0 [, array $options ]] )的第二个参数$options用于过滤掉不想被profile的函数,过滤函数功能的实现:
1、在xhprof_enable()中会先执行:hp_get_ignored_functions_from_arg(optional_array),将要忽略的函数存储到char **hp_globals.ignored_function_names中。
2、接着执行hp_ignored_functions_filter_init()初始化uint8 hp_globals.ignored_function_filter[XHPROF_IGNORED_FUNCTION_FILTER_SIZE],具体代码如下:
1
2
3
4
5
6
7
8
9
10
11
static void hp_ignored_functions_filter_init() {
  if (hp_globals.ignored_function_names != NULL) {
    int i = 0;
    for(; hp_globals.ignored_function_names[i] != NULL; i++) {
      char *str  = hp_globals.ignored_function_names[i];
      uint8 hash = hp_inline_hash(str);//根据函数名做hash
      int   idx  = INDEX_2_BYTE(hash);//hash >> 3
      hp_globals.ignored_function_filter[idx] |= INDEX_2_BIT(hash);//1 << (hash & 0x7)
    }
  }
}
因为XHPROF_IGNORED_FUNCTION_FILTER_SIZE为32,所以INDEX_2_BYTE(hash)将hash右移3位,高位补0,确保得到的idx不会超过32。
hp_globals.ignored_function_filter是uint8类型数组,所以INDEX_2_BIT(hash)就是将hash映射到这8个bit中的某个位置。
也就是说一个hp_globals.ignored_function_filter的元素有可能保存多个hash值的映射。
3、过滤的判断是通过hp_ignore_entry()->hp_ignore_entry_work()进行的,具体代码:
1
2
3
4
5
6
7
8
9
10
11
12
13
14
15
16
17
18
19
20
21
22
23
24
25
int hp_ignored_functions_filter_collision(uint8 hash) {
  uint8 mask = INDEX_2_BIT(hash);
  return hp_globals.ignored_function_filter[INDEX_2_BYTE(hash)] & mask;
}
/*
该方法首先判断curr_func的hash是否在过滤列表hp_globals.ignored_function_filter中
如果存在,因为存在hash碰撞,那么还需要判断curr_func是否在hp_globals.ignored_function_names中

hp_globals.ignored_function_filter的存在就是为了减少直接根据函数名去判断是否需要过滤
*/
int  hp_ignore_entry_work(uint8 hash_code, char *curr_func) {
  int ignore = 0;
  if (hp_ignored_functions_filter_collision(hash_code)) {
    int i = 0;
    for (; hp_globals.ignored_function_names[i] != NULL; i++) {
      char *name = hp_globals.ignored_function_names[i];
      if ( !strcmp(curr_func, name)) {
        ignore++;
        break;
      }
    }
  }

  return ignore;
}
二、打点采集性能数据的实现:
在hp_begin(long level, long xhprof_flags TSRMLS_DC)中,替换掉了zend内核execute_data的执行函数以及一些编译代码的函数,相当于加了一层proxy,部分代码如下:
1
2
3
4
5
6
7
8
9
10
11
    _zend_compile_file = zend_compile_file;//编译PHP文件
    zend_compile_file  = hp_compile_file;

    _zend_compile_string = zend_compile_string;//PHP的eval函数
    zend_compile_string = hp_compile_string;

    _zend_execute_ex = zend_execute_ex;//execute_data的执行函数
    zend_execute_ex  = hp_execute_ex;

    _zend_execute_internal = zend_execute_internal;//内部函数(C函数)的执行
    zend_execute_internal = hp_execute_internal;
在每一层proxy中,都会调用BEGIN_PROFILING和END_PROFILING,以hp_execute_ex为例:
1
2
3
4
5
6
7
8
9
10
11
12
13
14
ZEND_DLEXPORT void hp_execute_ex (zend_execute_data *execute_data TSRMLS_DC) {
  ……

  BEGIN_PROFILING(&hp_globals.entries, func, hp_profile_flag);//函数执行前打点
#if PHP_VERSION_ID < 50500
  _zend_execute(ops TSRMLS_CC);
#else
  _zend_execute_ex(execute_data TSRMLS_CC);
#endif
  if (hp_globals.entries) {
    END_PROFILING(&hp_globals.entries, hp_profile_flag);//函数执行结束记录统计信息
  }
  efree(func);
}
三、xhprof_disable输出数据中ct和wt的实现
ct是当前代码块被执行的次数,在END_PROFILING->hp_globals.mode_cb.end_fn_cb->hp_mode_hier_endfn_cb->hp_mode_shared_endfn_cb中:
1
hp_inc_count(counts, "ct", 1  TSRMLS_CC)
在每次代码块执行结束后就会对其对应的ct增1。
wt是当前代码块总的执行时间(wall clock time),在END_PROFILING->hp_globals.mode_cb.end_fn_cb->hp_mode_hier_endfn_cb->hp_mode_shared_endfn_cb中:
1
2
3
4
tsc_end = cycle_timer();

hp_inc_count(counts, "wt", get_us_from_tsc(tsc_end - top->tsc_start,
        hp_globals.cpu_frequencies[hp_globals.cur_cpu_id]) TSRMLS_CC);
top->tsc_start是在BEGIN_PROFILING->hp_globals.mode_cb.begin_fn_cb->hp_mode_hier_beginfn_cb()中通过cycle_timer()获得的,具体代码:
1
2
3
4
5
6
7
8
//通过rdtsc汇编指令获取CPU时钟周期
static inline uint64 cycle_timer() {
  uint32 __a,__d;
  uint64 val;
  asm volatile("rdtsc" : "=a" (__a), "=d" (__d));
  (val) = ((uint64)__a) | (((uint64)__d)<<32);
  return val;
}
hp_globals.cpu_frequencies[hp_globals.cur_cpu_id]存储了各个CPU对应的时钟频率,时钟频率的获取是通过如下方式:
1
2
3
4
5
6
7
8
9
10
11
12
13
14
15
16
17
18
19
20
21
22
23
24
25
26
27
28
29
30
31
32
33
34
35
36
37
38
39
40
41
42
43
44
45
46
47
48
49
50
static double get_cpu_frequency() {
  struct timeval start;
  struct timeval end;

  if (gettimeofday(&start, 0)) {
    perror("gettimeofday");
    return 0.0;
  }
  uint64 tsc_start = cycle_timer();
  /* Sleep for 5 miliseconds. Comparaing with gettimeofday's  few microseconds
   * execution time, this should be enough. */
  usleep(5000);
  if (gettimeofday(&end, 0)) {
    perror("gettimeofday");
    return 0.0;
  }
  uint64 tsc_end = cycle_timer();
  // 时钟周期数/时间 = 时钟频率
  return (tsc_end - tsc_start) * 1.0 / (get_us_interval(&start, &end));
}

static void get_all_cpu_frequencies() {
  int id;
  double frequency;

  hp_globals.cpu_frequencies = malloc(sizeof(double) * hp_globals.cpu_num);
  if (hp_globals.cpu_frequencies == NULL) {
    return;
  }

  /* Iterate over all cpus found on the machine. */
  for (id = 0; id < hp_globals.cpu_num; ++id) {
    /* Only get the previous cpu affinity mask for the first call. */
    if (bind_to_cpu(id)) {//为了测定每个CPU核的时钟频率,需要先绑定到指定的核上运行
      clear_frequencies();
      return;
    }

    /* Make sure the current process gets scheduled to the target cpu. This
     * might not be necessary though. */
    usleep(0);

    frequency = get_cpu_frequency();
    if (frequency == 0.0) {
      clear_frequencies();
      return;
    }
    hp_globals.cpu_frequencies[id] = frequency;
  }
}
在获取了每个核的CPU时钟频率后,会随机地绑定到某个核上继续执行。
最后在get_us_from_tsc()中,通过代码块执行花费的时钟周期数/当前CPU时钟频率得到代码块执行的时间wt。采用这种方式能更精确地获取wt,欲详细了解可以去研究下micro-benchmarking= =。
四、xhprof_disable输出数据中cpu的实现
在END_PROFILING->hp_globals.mode_cb.end_fn_cb->hp_mode_hier_endfn_cb中:
1
2
3
4
5
6
7
8
9
10
11
  if (hp_globals.xhprof_flags & XHPROF_FLAGS_CPU) {
    /* Get CPU usage */
    getrusage(RUSAGE_SELF, &ru_end);//系统调用,获取当前进程的资源使用情况

    /* Bump CPU stats in the counts hashtable */
    hp_inc_count(counts, "cpu", (get_us_interval(&(top->ru_start_hprof.ru_utime),
                                              &(ru_end.ru_utime)) +
                              get_us_interval(&(top->ru_start_hprof.ru_stime),
                                              &(ru_end.ru_stime)))
              TSRMLS_CC);
  }
top->ru_start_hprof是在hp_mode_hier_beginfn_cb()中通过getrusage()设置的。
ru_utime为user time,ru_stime为system time,两者加起来就得到cpu time了。
五、xhprof_disable输出数据中mu和pmu的实现
在END_PROFILING->hp_globals.mode_cb.end_fn_cb->hp_mode_hier_endfn_cb中:
1
2
3
4
5
6
7
8
9
if (hp_globals.xhprof_flags & XHPROF_FLAGS_MEMORY) {
    /* Get Memory usage */
    mu_end  = zend_memory_usage(0 TSRMLS_CC);
    pmu_end = zend_memory_peak_usage(0 TSRMLS_CC);

    /* Bump Memory stats in the counts hashtable */
    hp_inc_count(counts, "mu",  mu_end - top->mu_start_hprof    TSRMLS_CC);
    hp_inc_count(counts, "pmu", pmu_end - top->pmu_start_hprof  TSRMLS_CC);
  }
top->mu_start_hprof和top->pmu_start_hprof已在BEGIN_PROFILING->hp_globals.mode_cb.begin_fn_cb->hp_mode_hier_beginfn_cb中通过zend_memory_usage和zend_memory_peak_usage赋值。这两个zend函数的实现:
1
2
3
4
5
6
7
8
9
10
11
12
13
14
15
16
17
18
19
20
21
ZEND_API size_t zend_memory_usage(int real_usage TSRMLS_DC)
{
    if (real_usage) {
        return AG(mm_heap)->real_size;//PHP实际占用了的系统内存
    } else {
        size_t usage = AG(mm_heap)->size;
#if ZEND_MM_CACHE
        usage -= AG(mm_heap)->cached;
#endif
        return usage;
    }
}

ZEND_API size_t zend_memory_peak_usage(int real_usage TSRMLS_DC)
{
    if (real_usage) {
        return AG(mm_heap)->real_peak;
    } else {
        return AG(mm_heap)->peak;
    }
}
可见,这里获取的mu和pmu是当前使用到的内存,不包括已从系统申请的但未使用的。
六、由上面可发现各项统计信息是通过hp_inc_count进行叠加得到的。
XHPROF_MODE_SAMPLED模式分析
一、该模式不支持过滤掉不想被profile的函数
二、打点方式与XHPROF_MODE_HIERARCHICAL模式相同,不同点在于BEGIN_PROFILING调用的是hp_mode_sampled_beginfn_cb,END_PROFILING调用的是hp_mode_sampled_endfn_cb,而在这两个函数中都只调用了hp_sample_check(),其代码如下:
1
2
3
4
5
6
7
8
9
10
11
12
13
14
15
16
17
18
19
20
21
22
23
void hp_sample_check(hp_entry_t **entries  TSRMLS_DC) {
  /* Validate input */
  if (!entries || !(*entries)) {
    return;
  }

  /* See if its time to sample.  While loop is to handle a single function
   * taking a long time and passing several sampling intervals. */
  while ((cycle_timer() - hp_globals.last_sample_tsc)
         > hp_globals.sampling_interval_tsc) {//如果当前时钟周期数 - 上一次的时钟周期数 > 采样的时钟周期间隔则继续采样

    /* bump last_sample_tsc */
    hp_globals.last_sample_tsc += hp_globals.sampling_interval_tsc;//将上一次的时钟周期数加上采样的时钟周期数间隔

    /* bump last_sample_time - HAS TO BE UPDATED BEFORE calling hp_sample_stack */
    incr_us_interval(&hp_globals.last_sample_time, XHPROF_SAMPLING_INTERVAL);//更新上一次的采样时间点

    /* sample the stack */
    hp_sample_stack(entries  TSRMLS_CC);//采样数据
  }

  return;
}
在hp_sample_stack()中就是往hp_globals.stats_count中添加:函数调用栈 => 采样时间点。
在hp_begin->hp_init_profiler_state->hp_globals.mode_cb.init_cb->hp_mode_sampled_init_cb中做了一些初始化工作:
1
2
3
4
5
6
7
8
9
10
11
12
13
14
15
16
17
18
19
20
21
22
23
24
25
26
27
28
29
30
31
32
void hp_mode_sampled_init_cb(TSRMLS_D) {
  struct timeval  now;
  uint64 truncated_us;
  uint64 truncated_tsc;
  double cpu_freq = hp_globals.cpu_frequencies[hp_globals.cur_cpu_id];

  /* Init the last_sample in tsc */
  hp_globals.last_sample_tsc = cycle_timer();//初始化开始采样的时钟周期数

  /* Find the microseconds that need to be truncated */
  gettimeofday(&hp_globals.last_sample_time, 0);//初始化开始采样的时间点
  now = hp_globals.last_sample_time;
  //XHPROF_SAMPLING_INTERVAL的值为0.1秒
  //hp_trunc_time的作用是将hp_globals.last_sample_time更新为XHPROF_SAMPLING_INTERVAL的整数倍
  hp_trunc_time(&hp_globals.last_sample_time, XHPROF_SAMPLING_INTERVAL);

  /* Subtract truncated time from last_sample_tsc */
  truncated_us  = get_us_interval(&hp_globals.last_sample_time, &now);//被hp_trunc_time 截断掉的时间
  truncated_tsc = get_tsc_from_us(truncated_us, cpu_freq);//截断掉的时间 转换为 时钟周期数
  //CPU的时钟周期数TSC是会在某些情况下被重置为0的
  //摘自维基百科:Even then, the CPU speed may change due to power-saving measures taken by the OS or BIOS, or the system may be hibernated and later resumed (resetting the TSC).
  //所以当程序刚好在TSC重置后运行,得到的hp_globals.last_sample_tsc就会很小,比如说10,13,就有可能小于truncated_tsc
  if (hp_globals.last_sample_tsc > truncated_tsc) {
    /* just to be safe while subtracting unsigned ints */
    hp_globals.last_sample_tsc -= truncated_tsc;//为了使last_sample_tsc和last_sample_time保持同步
  }
  //对于hp_globals.last_sample_tsc <= truncated_tsc的情况,出现的可能性非常小,即使真的出现了也只是漏了第一次采样

  /* Convert sampling interval to ticks */
  hp_globals.sampling_interval_tsc =
    get_tsc_from_us(XHPROF_SAMPLING_INTERVAL, cpu_freq);//根据采样的时间间隔计算出采样的时钟周期数间隔
}
三、函数调用堆栈的实现
对于每一个hp_entry_t(即分析点),都会有一个prev_hprof属性指向上一层的分析点,hp_get_function_stack(hp_entry_t *entry, int level, char *result_buf, size_t result_len)就是通过这个将函数调用堆栈的函数名串起来,在XHPROF_MODE_SAMPLED模式下level传参是INT_MAX,也就是说尽可能的将整个函数调用栈的函数名串起来返回,而在XHPROF_MODE_HIERARCHICAL模式下level传参是2,也就是说只取当前跟其上一级的函数名串起来返回,从两种模式的输出结果就可以看出来了。
总结
从以上分析,基本了解到了xhprof的整个实现,也更清楚的知道xhprof的性能分析数据的含义,即使是采用XHPROF_MODE_HIERARCHICAL模式,我们也知道xhprof只是在每个函数执行前后进行打点和采样,对性能的影响是很小的。